

Fragility and Resilience, Part II
Izak Odendaal, Old Mutual Wealth Investment Strategist
Global markets slumped in March as American and Israeli attacks on Iran triggered a regional war and sharp rise in energy prices. As discussed last week, this marks the fifth major crisis to hit the world in a mere six years, following Covid-19, the post-pandemic inflation surge, the Russian invasion of Ukraine, and the 2025 US tariff shock. Each time, markets bounced back quickly even though uncertainty remained. The returns over this turbulent period are probably much better than anyone would have expected had they known in advance what was coming.
Chart 1: 7-year annualised asset class returns in rand
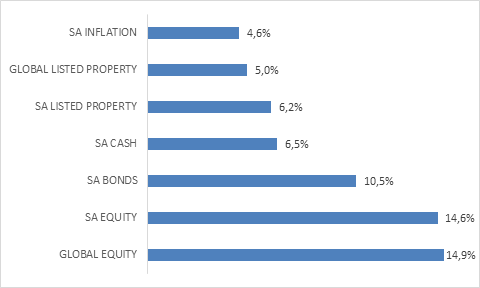
Source: LSEG Datastream. Returns to end March 2026, inflation to February 2026
Indeed, anyone with the foresight to anticipate any of these crises, let alone all five, might have chosen to sell and wait the situation to resolve itself. In each case, they would’ve waited a long time, ultimately missing the market rebound. Chart 1 summarises the returns over the entire period from the point of view of rand-based investors, including the sharp declines in March. To the five global crises, we can also add uniquely South African ones: severe loadshedding, logistics chaos and the July 2021 riots. The South African economy struggled over this period, but the real returns local investors enjoyed in a standard retirement portfolio are nothing to be sneezed at.
The current crisis is following a similar pattern. While it is by no means over, things seem to be moving in the right direction as both the US and Iranian governments have, for very different reasons, an incentive to scale back the conflict. Talks are taking place behind the scenes, and Iran declared on Friday that the Strait of Hormuz is “completely open” though it backtracked on Saturday since the US blockade remains in place. It still means that oil ended the week sharply lower, while the dollar was weaker and equities higher. Notably, however, equities have rallied since the start of the month. Markets are forward-looking and started pricing in a de-escalation a few weeks ago already. No-one knows exactly when or how the war will end, but markets have sensed that an end is coming.
Chart 2: Brent Crude oil front-month contract
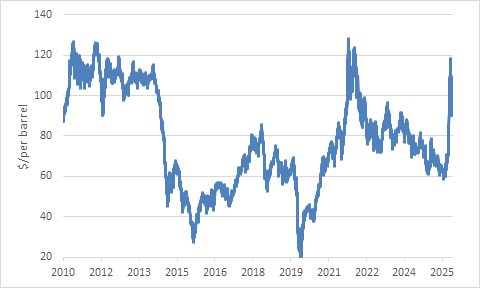
Source: LSEG Datastream
This poses a risk. If for whatever reason the conflict escalates again, we’re back to square one. Nonetheless, it is a reminder of how difficult it is to time the market, and why it is usually better to just sit tight during volatility and uncertainty. The market will usually price in a change in the environment much quicker than most investors can respond.
Chart 3: Equity indices in dollars
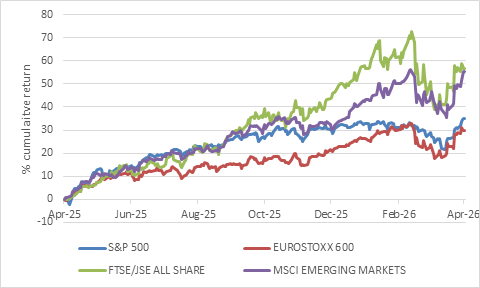
Source: LSEG Datastream
The lesson is also not that equities will consistently deliver 30% to 40% returns over every 12-month period as is the case currently. Far from it. Rather, the superior long-term returns of equities as an asset class stems from the occasional outsized 30%-plus year. Miss it, and you miss out. Without these extraordinary jumps higher, the long-term returns of equities would be much more subdued. Numerous studies show that missing the ten best days in the equity market over a 10-year period (or longer) typically reduces overall returns by around 40%.
The returns in chart 1 underscore a general resilience and adaptability in the global economy, since equity prices ultimately follow earnings (profits) generated by listed businesses. There have also been specific sources of support. One has been the massive artificial intelligence (AI) capex boom of the past year or so. It has also caused significant unease. If it is a bubble, as many suggest, it is probably the most unloved bubble in history. The concerns stem not only from the risks of overinvestment, namely whether the hundreds of billions of dollars spent on datacentres can earn an adequate return, but also on how AI will disrupt the world economy, including the demand for labour and the business models of companies who were traditionally considered to have very strong competitive moats. Before the war broke out, market anxieties were largely centred on software providers, leading to share price declines in the broader tech sector.
The so-called private credit funds that lent large amounts of money to some of these software companies also came under more scrutiny. Private credit funds raise money from institutional investors and then lend to companies who cannot or don’t want to borrow from banks or public markets. They therefore filled an important gap in providing funding for business, though over time also morphed into a vehicle for gearing up private equity buyouts. The rapid growth of private credit creates two potential problems: declining credit quality as loans are made in haste or at unrealistic prices, and the fact that newer investors do not understand the long-term and illiquid nature of the asset class. Retail investors have pulled out billions in the last few months, leading some funds to halt or cap withdrawals. This only served to spook other investors, who also rushed for the exit. There are parallels with the 2008 financial crisis, where problems in the small sub-prime mortgage market ultimately brought down giant banks. However, there are important differences, namely that those banks relied on short-term funding, while private credit funds can lock in their investors, ultimately containing any losses.
Importantly, while there are pockets where private debt levels have increased, we have not seen a large and broad-based increase in household and corporate leverage across developed countries as was the case in the lead-up to the financial crisis. High private debt levels create an underlying vulnerability to economic or financial shocks, including an oil price spike.
Too high
However, the same cannot be said of public debt. Chart 4 shows the changes in government debt-to-GDP ratios from 2019 to last year for selected economies. While Greece has admirably reduced its extremely high debt ratio – a story of recovery from deep crisis that does not receive enough attention – debt levels in other large economies have increased to record highs.
Chart 4: Government debt to GDP ratios
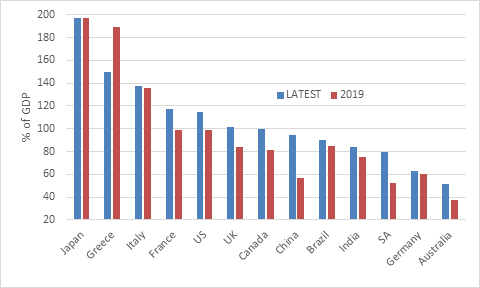
Source: Bank for International Settlements
In a crisis, it is good to have a government act as borrower and spender of last resort. The flipside of rising government debt levels over the past six years, and indeed the past 15 years, has been significant stimulus for the global economy and is a reason why it weathered the five crises so well. When a government increases its borrowing (runs a deficit) it is injecting more money into the economy than it withdraws through taxes. The big increase in US debt, for instance, occurred in response to the pandemic, when both the Trump and Biden administrations implemented stimulus packages.
When the crisis subsides, however, there should be a debt stabilisation plan, in part to be able to respond in the next shock. Funds must be available for the proverbial rainy day. South Africa’s government had almost no fiscal buffer to support the economy when Covid hit in 2020. In 2026, elevated precious metals prices and a slightly better debt profile mean it was able to cushion the blow somewhat with a fuel levy cut. However, it is temporary and limited in nature.
In the US, debt levels have continued increasing, even in the strong post-Covid economy. The second Trump administration has overseen a further expansion in borrowing to finance tax cuts, mostly for the rich. Unlike households and corporates, governments who borrow in their own currency cannot go bankrupt, but that doesn’t mean they can keep accumulating debt forever. At some point, savers will stop lending to profligate governments or only lend at painfully high interest rates. Government bond yields have already increased, meaning that new borrowing and rolling over maturing debt is now done at higher interest rates. Moreover, yields rose further when the war broke out, instead of falling as would be expected when there is a big risk event.
Chart 5: Developed market government bond yields, %
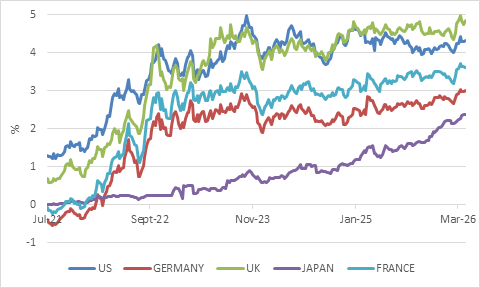
Source: LSEG Datastream
In the years ahead, global fiscal pressures will probably intensify. Countries will spend more on defence. Energy security, whether in the form of an accelerated green transition or more spending on fossil fuels, will continue. Ageing populations will also raise the pension and healthcare burdens on many governments. In the short term, there is also the matter of tax breaks and subsidies to soften the blow from the spike in fuel prices. And in the case of the US, the war itself has burned through billions.
Rising government debt is probably the biggest source of fragility for markets over the longer-term, especially when combined with the fact that the ownership of government debt has shifted somewhat from “patient” long-term buyers like pension funds and life insurers to hedge funds who try exploit small differences between cash and futures prices (so-called basis trades) or use bonds as collateral in other trades.
However, this is a can that can be kicked down the road for a long time. Along the way, governments can force domestic banks and pension funds to buy their bonds, among other forms of financial repression. They cannot force foreigners to do the same, however, and such steps are likely to lead to weaker currencies for the worst offenders. This might include the US itself.
Unknown unknowns
Nonetheless, known risks rarely cause major troubles for investors, as they tend to be priced in. Counterintuitively, if people are worried about something, it is usually a good sign. It is the underappreciated risks that can sink markets, such as an unexpected deep economic downturn or sharp interest rate hiking cycle. Exuberance and overconfidence can further heighten these risks. Therefore, reacting to news headlines is not a very useful portfolio management strategy. Diversification, a strong valuation discipline and patience remain the best approach in a world that remains very uncertain.


