

Which equity styles are performing well? The answer may surprise you
Your views on which stocks are performing well internationally are probably wrong – how might you respond?
By Duncan Lamont, Head of Strategic Research at Schroders.
Most people think of the current bull market as a “Growth” stock rally, backed by the US Magnificent-7. But that is only true in the US. The opposite is true internationally, where performance, sector make-up, and valuations are very different. The “Value” style has been flying.
This may come as a surprise because, when you look at the performance of global markets, what you are really looking at is the performance of the US, given its 75% weight. What happens in the other 25% barely registers.
Incorrectly extrapolating US performance to the rest of the world means opportunities are likely to have been missed. However, there are concrete actions you can take today to respond and position for the future.
Please see the end of this article for brief descriptions of the different equity styles discussed.
Turning the performance tables
In EAFE (Europe, Australasia, and the Far East, a stock market index designed to represent global developed markets excluding North America), Value returned 20% in USD terms in the 12 months to 31 August 2025, outperforming the market by 6% and “Growth” stocks by 13%. Growth stocks themselves lagged the market by 6%.
This is the reverse of the US experience that we read about all the time. Stateside, Value has underperformed Growth by 17% and the market by 8% in the past year.
The scale of these recent performance swings in EAFE are so great that they now also feed into more medium-term numbers. Over three- and five-year horizons, Value is well ahead of Growth and the market. European and UK Value stocks (MSCI EMU Value and MSCI UK Value) are not only ahead of their Growth equivalents; they’re also ahead of the S&P 500 over the past five years (in both common currency and local currency terms).
A regular, heavily US-influenced, question is, “what would it take for Value stocks to outperform again?” Outside of the US it has already happened!
Another segment that has struggled in the US but performed much better outside is High Dividend stocks. Past performance might not be a guide to the future, but things are clearly different outside the US.
One area of commonality has been the recent terrible performance of “Quality” stocks (those with more stable operating performance, better return on equity, lower leverage, etc.). These have outperformed over the long run in both the US and EAFE but have had a torrid 12 months. Quality has underperformed the market by 12% in EAFE and 7% in the US. In EAFE, this has been so punitive that Quality is also now well behind on a three- and five-year basis.
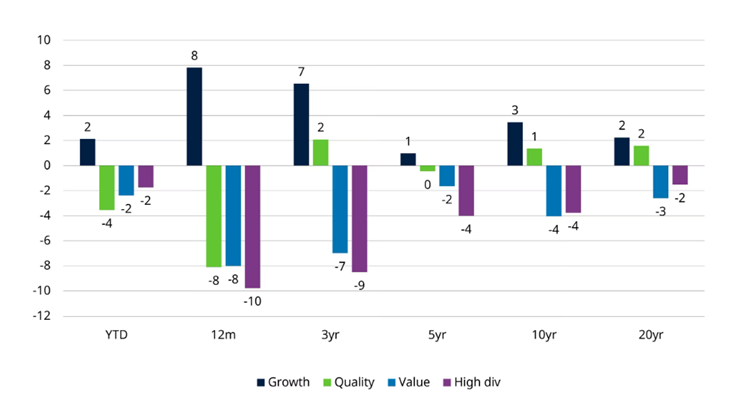
It’s been a Value and High Dividend market in EAFE. Growth and Quality have languished
Performance vs MSCI EAFE in USD, % p.a. other than YTD which is %
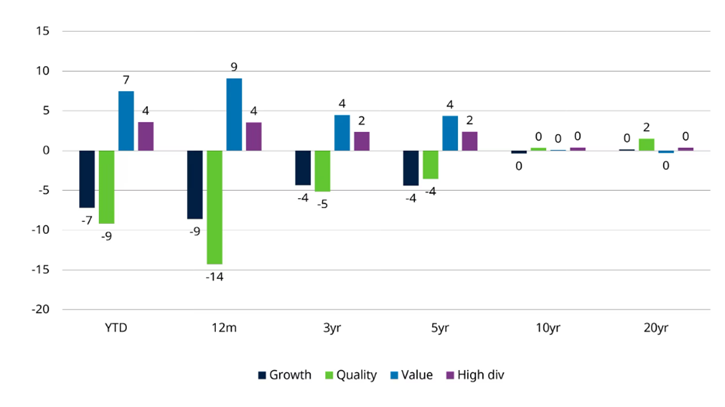
Past performance is not a guide to the future and may not be repeated. Based on performance MSCI USA growth, MSCI USA quality, MSCI USA value, and MSCI USA high dividend indices relative to MSCI USA. Data to 31 August 2025. Source: LSEG Datastream, MSCI
Whereas in the US, Growth has been clear top dog
Performance vs MSCI USA, % p.a. other than YTD which is %
Past performance is not a guide to the future and may not be repeated. Based on performance MSCI USA growth, MSCI USA quality, MSCI USA value, and MSCI USA high dividend indices relative to MSCI USA. Data to 31 August 2025. Source: LSEG Datastream, MSCI
In fact, in EAFE, the underperformance of Quality over the past three years is now the worst for around three decades. Growth stocks have been struggling for some time.
In EAFE, Quality’s performance over the past three years is near its worst for three decades; Growth has also been in the doldrums
Rolling 36-month relative performance, % p.a. USD terms
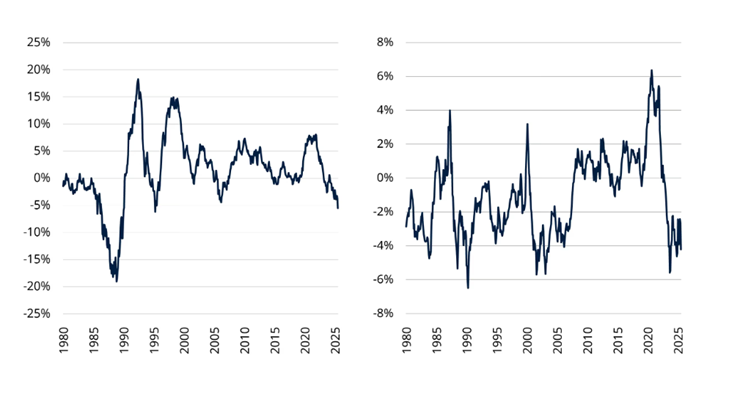
Past performance is not a guide to the future and may not be repeated. Data to 31 August 2025. Source: LSEG Datastream, MSCI, and Schroders
What have been the drivers of performance?
In the US, Growth companies have been rewarded for their better earnings growth (driven by technology companies). Outside it they have not. EAFE Growth companies have underperformed despite having superior earnings growth (Figure 3 shows this over the last 12 months but it has also been true over the last three years).
Rising valuations have been in the driving seat for Value and High Dividend styles. They’ve done very well despite weak earnings. This is partly a reversal of the valuation extremes that existed previously (see later section), and which still exist in the US.
Arguably, downgrades to the outlook for Quality earnings over the past 12 months are consistent with poorer relative performance. An appeal of Quality stocks is the robustness of their businesses, so any weakness on that front is unlikely to go down well.
A tale of two markets with very different recent performance drivers
US 12-month return decomposition (LHS) and EAFE 12-month return decomposition, USD terms (RHS)
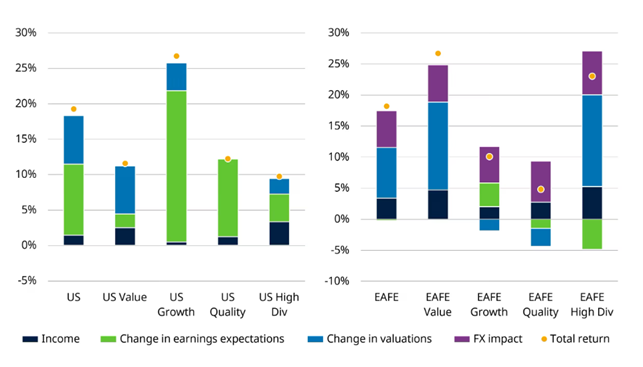
Past performance is not a guide to the future and may not be repeated. Figures do not sum exactly as the total return is the compound return of the individual components. Analysis is based on change in 12-month forward earnings and change in 12-month forward price/earnings multiple. Based on performance of MSCI USA, MSCI USA Value, MSCI USA Growth, MSCI USA Quality, and MSCI USA high dividend indices, and EAFE equivalents. Data to 31 August 2025. Source: LSEG Datastream, MSCI, and Schroders
We’re focusing on the US and EAFE in this article, but it is worth highlighting that these trends have also happened in many emerging markets. China is a particularly extreme case where, astonishingly, Value stocks are up over 40% in the past 12 months despite 12-month forward earnings expectations being slightly lower today than they were 12 months ago. Quality has underperformed in China, even though Quality companies’ earnings have been strong.
Rising valuations have powered Chinese equities to astonishing returns, despite lacklustre fundamentals
China: 12-month return decomposition, USD
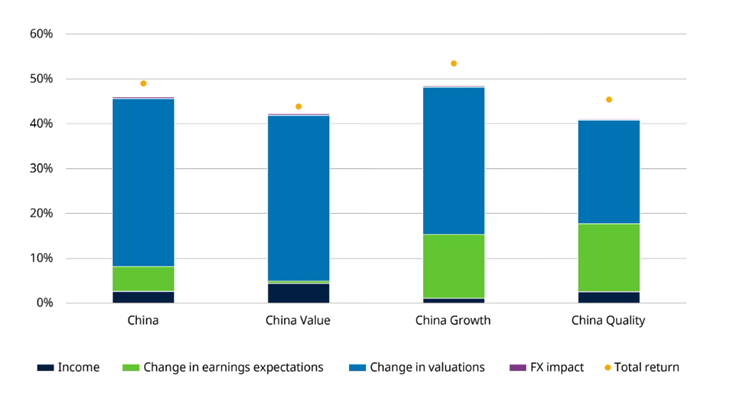
Past performance is not a guide to the future and may not be repeated. Figures do not sum exactly as the total return is the compound return of the individual components. Analysis is based on change in 12-month forward earnings and change in 12-month forward price/earnings multiple. Based on performance of MSCI China, MSCI China value, MSCI China growth, MSCI China quality indices in USD terms. Data to 31 August 2025. Source: LSEG Datastream, MSCI, and Schroders
The trashiest of the trash have been the biggest winners
Every now and then markets perform in ways that ignore the fundamentals. Recently, it’s been the lowest-quality companies that have performed the best. If we deal with the real problem children, those that were loss-making 12 months ago and are still loss-making today, they have outperformed companies that were consistently profitable by more than 10% in the past 12 months. This has happened in both the US and EAFE. There are relatively few companies that fit this description in the large cap space (2% of EAFE companies, 5% of US ones), but the scale of their outperformance is noteworthy.
12-month market-cap weighted performance, USD terms
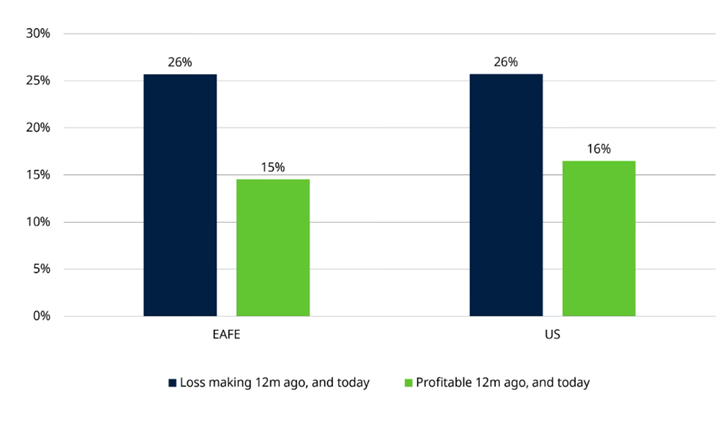
Past performance is not a guide to the future and may not be repeated. Analysis of the subsequent 12-month performance of constituents of MSCI EAFE and MSCI USA indices on 31 August 2024. Performance covers the period 31 August 2024 to 31 August 2025. Constituents are filtered based on whether trailing earnings per share was positive or negative on 31 August 2024, Portfolios are market cap weighted based on weights on 31 August 2024. Source: LSEG Datastream, MSCI, and Schroders
A word on sector allocations
When investors think of Growth companies they think of technology (IT). And this is true in the US, where over half the sector by market capitalisation is IT. In addition, Amazon and Tesla are in consumer discretionary, and Alphabet is in communication services. IT + Amazon + Alphabet + Tesla = 70% (perversely, Meta is not a member of the MSCI USA Growth index, it is the largest stock on the MSCI USA Value index).
But, as with performance, it is wrong to extrapolate the US to the rest of the world. IT is only 14% of Growth in EAFE, whose allocation is much more diverse. The biggest sector is Industrials, on 27%, while the healthcare weighting is also triple the US equivalent. The perception of growth stocks being a play on AI/technology simply doesn’t translate that well outside of the US. The same is true of Quality, where IT has a much bigger weight in the US. Value is one area where there are greater similarities, with financials being the biggest sector both within and outside the US.
EAFE Growth is not a big bet on technology, unlike the US
Sector weights as at 31 August 2025
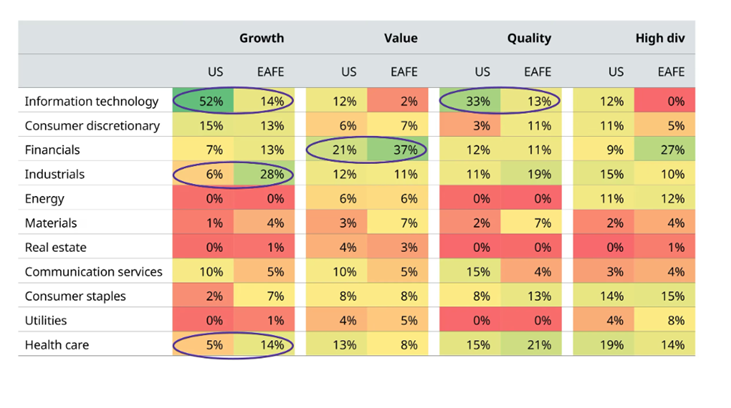
Past performance is not a guide to the future and may not be repeated. Based on sector weights of MSCI USA Growth, MSCI USA Value, MSCI USA Quality, and MSCI USA high dividend indices, and EAFE equivalents. Data as at 31 August 2025. Source: LSEG Datastream, MSCI, and Schroders
Valuation extremes between styles have largely unwound in EAFE
A few years ago, Growth and Quality stocks both traded on expensive valuations in EAFE when compared with history, while Value and High Dividend stocks were cheap. However, the recent swings in performance mean that these divergences have all reduced substantially.
Quality trades at a slight discount to historical valuations. This is true for trailing and forward price/earnings multiples. It is also the opposite of the situation in the US, where it trades at a significant premium.
Value and High Dividend stocks had fallen to very cheap levels but, because share price growth has significantly outperformed earnings growth, that is no longer the case.
Growth still looks expensive vs history in EAFE, but the degree of expensiveness is nothing like in the US.
Growth has been cheapening vs Value in EAFE and is currently the cheapest vs Value for around six years. Growth stocks are still relatively expensive vs Value on a longer-term historical basis.
This cheapening of Growth vs Value has also happened in the US, despite Growth’s outperformance there. This has happened because US Growth company earnings have been so much stronger than those of Value.
Forward P/E valuation vs 10-year median
EAFE (LHS) and US (RHS)
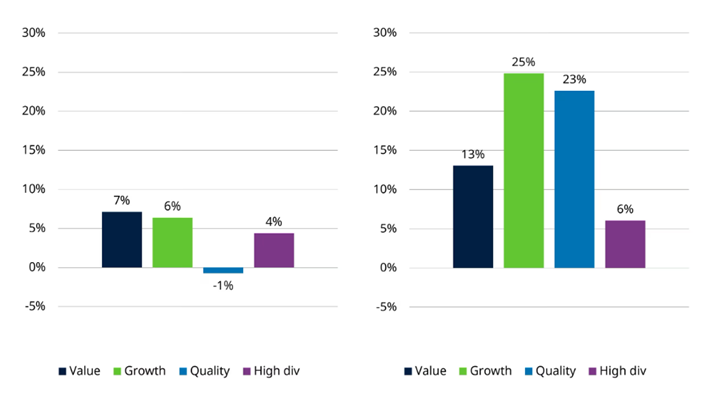
Past performance is not a guide to the future and may not be repeated. Source: LSEG Datastream, MSCI and Schroders. Data to 31 August 2025. Figures are shown on a rounded basis.
EAFE forward P/E multiples
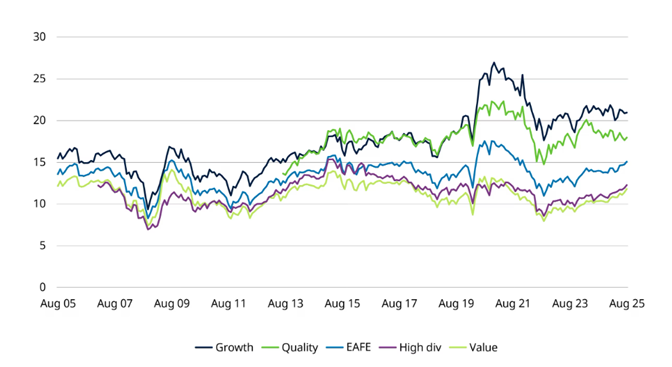
Past performance is not a guide to the future and may not be repeated. Source: LSEG Datastream, MSCI and Schroders. Data to 31 August 2025. Figures are shown on a rounded basis.
EAFE forward P/E multiples: growth vs value
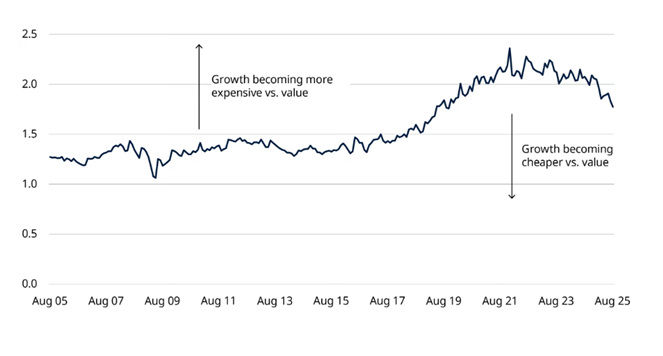
Past performance is not a guide to the future and may not be repeated. Source: LSEG Datastream, MSCI and Schroders. Data to 31 August 2025. Figures are shown on a rounded basis.
What does this mean for investors?
Outside the US, valuations have converged on more neutral levels across the styles. Quality is no longer expensive, Growth is no longer as expensive, Value and High Dividend stocks are no longer cheap. Everything is much more reasonable, in isolation and relative to each other.
This is in stark contrast to the US, where valuations are far more stretched in absolute terms and relative to each other, when compared with history.
How should investors respond? Valuations are not the only factor to consider, although they do matter a lot in the long run. With many of the recent extremes in EAFE now unwound, it calls for investors with a longer-term outlook to consider a more neutral, balanced, style allocation. This doesn’t mean one particular style can’t go on a run, or another a period of tough performance, but there is less of a valuation case to expect that. And, in a world where uncertainties abound, diversifying by styles should increase your chance of earning resilient portfolio returns.
Another important point is that many stocks, styles and countries in the global stock market are performing well. Many are outperforming the US. But, if you’re passively tracking the global stock market, as increasing numbers of investors are, you have hardly any exposure to them in your portfolio. At the end of August, the US was nearly three quarters of the global market. The Magnificant-7 make up more than Japan, UK, China, Canada, France, Germany and Switzerland combined. That means those seven stocks have a bigger weight than the next seven biggest countries combined. Global portfolios are loaded up on US mega-cap growth-style risk and have hardly any exposure to the wider opportunity set. The fact that many other parts of the market are performing differently, and better, than the US, amounts to barely a rounding error in many investors’ returns.
The case for unshackling yourself from the benchmark with a more active approach to investing has never been greater.
Appendix: style descriptions:
Growth: companies with stronger historical and forecast growth rates.
Value: companies which are trading on cheap valuation multiples, such as price/book, price/earnings, etc.
Quality: companies with more stable operating performance, better return on equity, lower leverage, etc.
High Dividend: companies which pay higher and more stable/persistent dividend yields


