

Implications of clean energy race
By: BlackRock Investment Institute (BII)
BlackRock’s Weekly Market Commentary
Key Points
- Clean energy race: We see the U.S. policy push for leadership in clean tech and Europe’s fast-developing response creating near-term and strategic investment opportunities.
- Market backdrop: Risk assets rallied amid stabilizing sentiment toward banks. Yet the disconnect between sticky inflation and market expectations of rate cuts persists.
- Week ahead: This week, we’re watching U.S. employment data to gauge how tight the labor market remains. We see wage pressures contributing to persistent inflation.
Implications of clean energy race
U.S. industrial policy has sparked a global clean energy race, we believe, opening up investment opportunities that so far have gone largely under the radar. It’s key not to lose sight of such profound policy developments amid market volatility. The U.S. already has strong incentives for domestic clean-tech production. The European Union (EU) now aims to speed up deployment of funds and to build out clean tech at home, driven by a search for energy security and competitiveness.

Source: BlackRock Investment Institute, Rocky Mountain Institute and European Commission, December 2022. Notes: The chart shows pledged funding (colored bars) versus previous funding (gray bars) by region taken from “Congress’s Climate Triple Whammy: Innovation, Investment, and Industrial Policy;” “Long-term EU budget 2021-2027 and recovery package;” “Fit for 55: Council and Parliament reach provisional deal …;” “Factsheet on Financing REPowerEU.”
The U.S. Inflation Reduction Act of August 2022 unleashed a slew of production incentives in areas tied to the transition to lower carbon emissions. The EU already had robust transition policy. An expanded carbon pricing program encourages EU firms to expedite transition plans, with the price of carbon recently passing €100 per tonne. The EU also had put even more public investment in aggregate on the table (see the chart). But an estimated $400 billion of that is still unspent, and the EU had less focus on encouraging domestic production of low-carbon technology. The EU responded to the U.S. this year with its Green Deal Industrial Plan (GDIP). This aims to boost European manufacturing of key transition technologies via domestic production targets, provide easier access to funding and fast-track permitting. The resulting growth in these areas is not always fully reflected in markets, in our view, creating global investment opportunities.
The U.S. and European policy initiatives are about getting a slice of the growing clean-tech pie and reducing reliance on China for minerals and metals needed for the transition, in our view. We see this as the start of a clean energy race as countries rush to adopt similar policies – a strategic priority against a backdrop of growing geopolitical fragmentation. The UK, Canada and Australia are all set to jump in, and this race fits with our view that the transition is likely to accelerate.
The EU has most at stake to ensure energy security as the West shuns Russian oil and gas, we think, and U.S. policy has shifted focus to domestic production. The EU has extended until the end of 2025 the temporary state aid rules introduced in response to the pandemic, renaming them the Temporary Crisis and Transition Framework. If implemented, this will make it easier for member states to offer similarly generous subsidies to prevent an exodus of clean-tech firms and capital to the U.S. The EU’s plan could unleash more extensive public funding for European clean-tech production. But questions remain: Will member states agree to step up spending within the new rules? Can they afford to given the estimated $350 billion already spent on energy bill support for consumers last year? Can they cut more red tape? And will the EU’s energy windfall taxes deter businesses and investors anyway?
The investment implications of these new policies depend on earnings impact and what’s already reflected in market prices. We think the potential growth implications for selected transition-linked assets are not fully reflected – creating opportunities to add to returns. U.S. stocks seen as benefitting from recent transition policy jumped ahead of EU peers after the Inflation Reduction Act passed – the latter still show little impact from the GDIP, our analysis shows. Sustained growth of global energy demand and the West’s shunning of Russian supplies mean we see ongoing demand for traditional energy – even with rapid growth of clean-energy production. Both traditional energy and renewable energy stocks outperformed their benchmarks last year, we find. Portfolios that exclude traditional energy are unlikely to be as resilient to the expected bumps in the transition to a lower-carbon economy, in our view. We think the new regime of more persistent and volatile inflation is likely to manifest in the transition as mismatches of supply struggling to meet rapidly increasing demand and investment.
Bottom line: We see opportunities within transition-linked assets and stay nimble and selective for global diversification as a clean energy race heats up. We favor inflation-linked bonds on the potential for supply and demand imbalances in the transition and see real assets like infrastructure providing long-term hedging against inflation.
Market updates
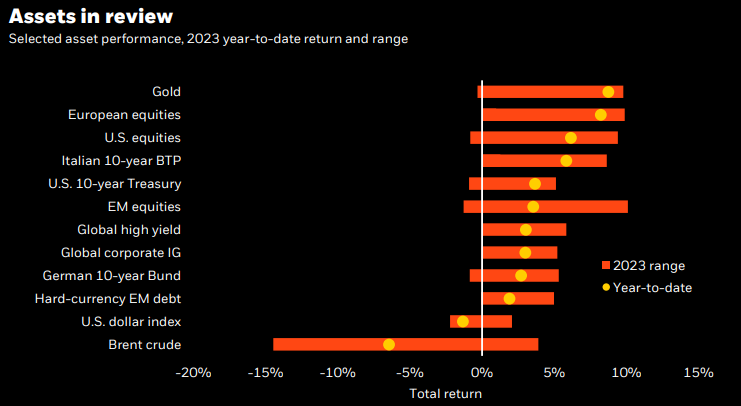
Past performance is not a reliable indicator of current or future results. Indexes are unmanaged and do not account for fees. It is not possible to invest directly in an index. Sources: BlackRock Investment Institute, with data from Refinitiv Datastreamas of Feb. 23, 2023. Notes: The two ends of the bars show the lowest and highest returns at any point in the last 12-months, and the dots represent current year-to-date returns. Emerging market (EM), high yield and global corporate investment grade (IG) returns are denominated in U.S. dollars, and the rest in local currencies. Indexes or prices used are: spot Brent crude, ICE U.S. Dollar Index (DXY), spot gold, MSCI Emerging Markets Index, MSCI Europe Index, Refinitiv Datastream 10-year benchmark government bond index (U.S., Germany and Italy), Bank of America Merrill Lynch Global High Yield Index, J.P. Morgan EMBI Index, Bank of America Merrill Lynch Global Broad Corporate Index and MSCI USA Index.
Market backdrop
Risk assets rallied this week amid stabilizing sentiment on banks to close a tumultuous quarter. Yet the disconnect between sticky inflation and market expectations of rate cuts persists. The Nasdaq – up nearly 20% in the first quarter of 2023 – had its best quarter in nearly three years. The two-year U.S. Treasury yield has steadied around 4.0% – about 1 percentage point below the 16-year high from early March with markets still eyeing two quarter-point Federal Reserve rate cuts this year.


