

A tale of two markets
Izak Odendaal, Old Mutual Wealth Investment Strategist
Excitement is building ahead of the stock exchange listings of Anthropic and SpaceX in the US. Anthropic is expected to be valued at around $900 billion, while SpaceX could be valued at $1.7 trillion. An initial public offering of OpenAI is also expected to be around the corner with estimates of a market value likely to be near 13 figures. All three companies are currently still loss-making, but investors are lining up to buy into what they believe to be substantial future profitability.
Companies typically list to raise money and to make it easier for existing shareholders to sell some of their shares. An additional bonus is that it can raise a company’s profile.
When a company lists on a stock exchange, only a portion of its shares is available to the public. Most of the shares will still be held by existing shareholders. The market value of the company will then be determined by multiplying the share price on the relevant exchange by the total number of shares, publicly and privately held. In the case of SpaceX, only between 3% and 5% of the company’s shares will be offered to market, an unusually small amount that is nonetheless expected to raise a record-breaking $75 billion. It will also target retail investors to an unusually large degree.
Few and far
Part of the reason for the excitement is because such large listings are few and far between. Indeed, the global trend in recent years has been for fewer existing companies to maintain listings and fewer new companies to come to market (with India and China as exceptions).
This is largely due to the cost of maintaining a listing and the associated compliance and disclosure burden; the growth of private equity, which typically buys firms and de-lists them; and the availability of venture capital and other forms of funding that allow firms to grow without having to raise capital on a stock exchange.
Chart 1: Number of listed domestic companies
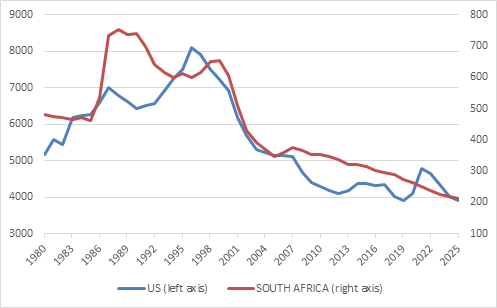
Source: World Bank
Buyback bonanza
Apart from the decline in the number of listed companies in the US market, the world’s largest by far, the number of outstanding shares has also fallen. This is because companies have actively repurchased their own shares. Federal Reserve data shown in Chart 2 illustrates that the gross issuance of new shares has basically been matched by repurchases since 2010. When mergers and acquisitions are also taken into account, net equity issuance was negative for most of this period, apart from the brief and largely speculative SPAC boom in 2021.
Chart 2: US equity issuance
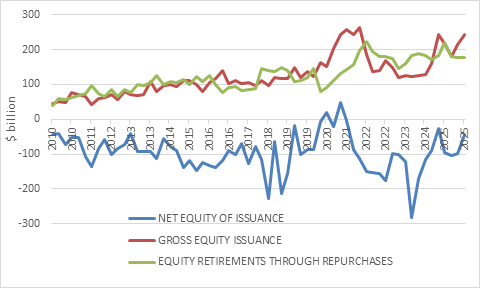
Source: Federal Reserve
Buybacks reduce the number of outstanding shares, meaning that remaining shareholders are entitled to a bigger proportion of profits and dividends. Therefore, it is a means of returning capital to shareholders, but also a means of supporting a flagging share price. However, unlike dividend payouts, which are considered near-permanent, buybacks are generally ad hoc. A company that repurchases shares in one year is under no obligation to do it another year.
According to S&P Dow Jones, the index provider, S&P 500 companies spent around $8 trillion on buying back their own shares in between 2015 and 2025, including $1 trillion last year. Many companies also borrowed to buy back shares, something that made sense when interest rates were very low, but not anymore. Chart 3 clearly shows how shares were cheap (high earnings yield) and borrowing costs low (low corporate bond yield) in the decade after 2010, but that is no longer the case.
Moreover, to spend $1 trillion on buybacks last year when shares were already expensive seems less than optimal. The $572 billion spent on buybacks represented 3% of the S&P 500 year-end market value in 2015, but the $1 trillion spent last year was only 1.6%.
Buybacks are less likely to support share prices in future, as more cash is diverted to ballooning AI capex requirements. Indeed, it was notable that Alphabet (Google’s holding company) announced last week it would sell $80 billion in shares to raise funds for its AI build-out. In other words, it plans to raise even more capital than SpaceX. This after spending more than $300 billion to buy back its shares over the previous decade.
Chart 3: S&P 500 equity and borrowing yields
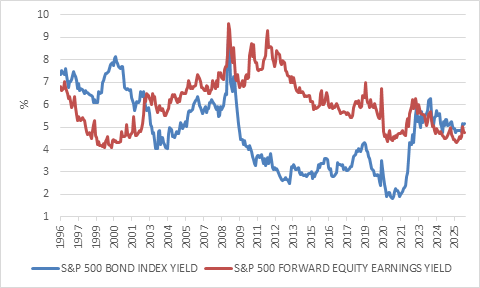
Source: LSEG Datastream
Some analysts worry that the market could struggle to absorb the three mega IPOs, with other large AI-related listings expected to follow and investors having to sell other shares to buy into the new ones. However, since these listings have been in the works for some time, active managers are likely to have already positioned portfolios accordingly, for instance by increasing cash levels. The problem is more likely to be on the passive side. Here, some index providers have changed their inclusion rules to rush SpaceX into their benchmarks. However, S&P Dow Jones indicated that it will not deviate from its inclusion process.
Another concern is that previous blockbuster IPOs occurred near the top of the market. The list includes the $18 billion listing of Japanese telco DoCoMo in 1998, near the height of the dotcom bubble, and Visa and Blackstone in 2007, at the peak of the financial boom (and the eve of the Great Financial Crisis). PetroChina also listed in 2007 as oil prices neared a still-unbroken record high, briefly holding the title of the first $1 trillion company. Glencore’s 2011 listing timed the top of the commodity cycle almost perfectly. Many IPOs don’t coincide with a particular point in the market cycle, so this point shouldn’t be pushed too far.
The association between large listings and market peaks is not because listings cause the cycle to roll over. Rather, it is because it makes perfect sense to list when the market is at its hottest and so maximise the capital raised (and the gains for the insiders selling). Good timing for the company selling the shares is not necessarily good timing for the investors buying. In other words, they should not fear the impact of large listings as much as what they are telling us about the current cycle, bearing in mind that absolutely no one knows exactly when the top or bottom of a market will be.
Dozy in Jozi
On the other side of the world, in Johannesburg, the number of listings on the 139-year-old JSE continues to dwindle. In the past year or so, several household names including Curro, Multichoice, Barloworld and Adcock Ingram waved the local bourse goodbye. This reduces the choice for local investors but also raises broader questions about how the next generation of growing businesses will be funded. In particular, the JSE’s once-vibrant junior mining sector has contracted considerably, along with a decline in exploration and development activity in the local mining industry.
The decline in the number of listed shares partly reflects the global trend described above but is also due to uniquely South African factors. A SA Reserve Bank note pointed to “persistent weak economic growth, low business confidence and onerous corporate governance requirements” as the main reasons. A new study led by the University of Cape Town economist Professor Haroon Lorgat estimates that the JSE has not performed worse than other exchanges in terms of net delistings but has been weaker when it comes to new listings. The study lists multiple factors that contribute to this lack of activity that can broadly be summarised into three areas: weak economic growth, institutional arrangements, and undervaluation.
Weak economic growth is largely self-explanatory. In a sluggish economy with low confidence levels fewer new firms require capital to scale and fewer mature firms require funding to expand. Weak growth also contributes to external factors like exchange rate volatility and a lack of foreign investors shopping around.
Institutional factors include the regulatory and compliance burden associated with maintaining a listing. Also, changes in the retirement fund landscape, with pension funds shifting from defined benefit to defined contribution arrangements, while Regulation 28 of the Pension Funds Act has gradually allowed for increased offshore exposure. Finally, following the 2008 financial crisis, there has been a decline in stock research and related activity from banks. Some of these issues are being addressed by the JSE, the broader financial services industry and regulators. This includes Operation Phumelela, the South African Financial Sector Competitiveness Taskforce.
Chart 4: Trailing price: earnings ratios
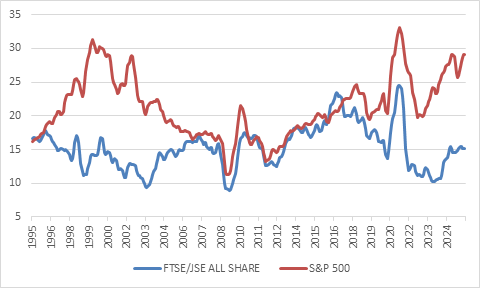
Source: LSEG Datastream
From the point of view of ordinary investors, the most relevant factor is probably the third, undervaluation. This is the inverse of the situation in the US, as chart 4 shows. Low valuations in South Africa means that equity is an expensive source of new funding for businesses (borrowing from banks and the bond market is not cheap either). It also means that JSE-listed companies are targets for mergers, acquisitions or private equity takeovers, and by implication attractive for long-term equity investors.
There is no reason to believe that this undervaluation will be resolved immediately, nor can we say what will cause the value to be unlocked. A better domestic growth profile will help, as will structurally lower inflation and interest rates. Similarly, no one knows when an expensive US market will return to more normal levels or what catalyst will trigger such a move. Friday’s sell-off reduces some of the froth, but with the US economy still showing resilience – indeed the declines were triggered by better-than-expected employment data – is not necessarily the start of something bigger. What we can say is that the odds of an upside surprise are higher in an undervalued market where expectations are already subdued, compared to an overvalued market where so much good news is already priced in.
Therefore, the expected real return in rand from South African equities over the next 5 to 10 years is higher than that of US equities, with the latter likely to be below long-term averages. However, there are risks associated with South African equities namely unpredictable commodity prices, political uncertainty and exchange rate volatility. Since the set of risks affecting US equities (overexposure to AI, overvaluation, strong dollar) and SA equities are so different, they make useful counterpoints in a diversified portfolio.
The next edition will be on 22 June.


